Welcome! If you're managing a network in a bustling school, a busy retail store, or a corporate office with a Bring-Your-Own-Device (BYOD) policy, you know that a slow or unreliable Wi-Fi connection isn't just an inconvenience, it's a showstopper. From students unable to access online resources to shoppers abandoning a purchase because the guest Wi-Fi is down, poor network performance directly impacts your goals. That's where top-tier network performance monitoring tools come in. This isn't just about spotting problems; it's about proactively ensuring a seamless, secure, and fast connection for every user.
In environments running robust hardware like Cisco and Meraki, pairing your infrastructure with the right monitoring tool is crucial. It allows you to get granular insights, especially when managing complex authentication solutions like Captive Portals with IPSK or EasyPSK. Beyond just monitoring, ensuring optimal user experience often involves broader performance considerations. For instance, understanding specific strategies to improve website speed can directly impact perceived network performance for users, alleviating common 'Wi-Fi headaches'.
This guide dives into the tools that can transform your network from a source of frustration into a powerful asset. We will explore each platform with in-depth analysis, screenshots, and direct links, ensuring every user connection is a positive experience.
1. Datadog – Network Monitoring
Datadog excels as a unified platform for monitoring complex network infrastructures, especially in hybrid and multi-cloud settings. It brings together network performance monitoring (NPM) and network device monitoring (NDM) into a single, cohesive view. This is incredibly useful for organizations in sectors like education, retail, and corporate environments managing extensive Bring Your Own Device (BYOD) policies.
This platform stands out by correlating network data with application and infrastructure metrics, providing deep visibility from global traffic down to individual device performance. For businesses using Cisco or Meraki hardware, Datadog’s SNMP-based monitoring provides granular data on routers, switches, and firewalls. This level of detail is critical for troubleshooting issues that could impact guest Wi-Fi, captive portals, or authentication solutions like iPSK and EasyPSK.
Key Features & Use Cases
- Unified Monitoring: Correlate network traffic with logs, traces, and metrics for a complete picture.
- Device Visibility: Keep tabs on crucial hardware like Cisco and Meraki switches and wireless access points.
- Flow Analytics: Analyze NetFlow and IPFIX data to understand traffic patterns and optimize bandwidth.
- Custom Dashboards: Build dashboards that focus on metrics vital to your specific environment, whether it's a university campus or a large retail center.
Pricing and Onboarding
Datadog offers transparent, public pricing on its website, typically billed per host, per device, or per million flow records. The SaaS model allows for rapid onboarding, which is a major plus. However, be mindful that costs can increase as you add more modules or scale up your monitoring efforts. Annual billing offers a discount compared to on-demand pricing.
Pro Tip: When setting up, use Datadog’s tagging system to segment your network by location, device type, or user group (e.g., student, corporate, guest). This simplifies troubleshooting, especially when you need help fixing problems with a Wi-Fi router.
- Website: https://www.datadoghq.com/pricing/
2. SolarWinds – Network Performance Monitor
SolarWinds Network Performance Monitor (NPM) is an enterprise-grade solution renowned for its deep troubleshooting capabilities, particularly in complex hybrid and on-premise environments. It offers powerful tools that help IT teams in sectors like hospitality, education, and retail gain comprehensive visibility into their network health, which is essential for supporting a high volume of BYOD users and guest devices connecting via captive portals.
The platform’s strength lies in its advanced features like NetPath, which visualizes the entire network path, and PerfStack, which correlates performance metrics across the stack. This allows administrators to pinpoint the root cause of issues impacting services reliant on Cisco or Meraki hardware, from slow authentication with iPSK or EasyPSK to poor guest Wi-Fi performance. This makes SolarWinds NPM a top choice among network performance monitoring tools for organizations needing granular control and powerful diagnostics.
Key Features & Use Cases
- Multi-vendor Monitoring: Automatically discovers and maps devices from a wide range of vendors, including Cisco and Meraki.
- NetPath Visualization: Provides hop-by-hop analysis to identify bottlenecks inside or outside your network.
- PerfStack Correlation: Drag-and-drop performance data from different sources onto a single chart for faster troubleshooting.
- Advanced Alerting: Create intelligent, topology-aware alerts to reduce unnecessary notifications and focus on critical issues.
Pricing and Onboarding
SolarWinds offers flexible deployment, either self-hosted or as part of the modular SolarWinds Observability platform. Pricing is typically quote-based, which can be complex but allows for a tailored solution. The on-premise version can have a heavier resource footprint compared to pure SaaS tools, so planning for hardware requirements is key.
Pro Tip: Use the PerfStack feature to compare network latency with wireless client connection times. This helps determine if slow Wi-Fi access is due to the network backbone or issues with the authentication server. Following these types of network monitoring best practices ensures a reliable user experience.
3. Paessler PRTG Network Monitor
Paessler PRTG Network Monitor is a powerful, all-in-one tool renowned for its sensor-based approach to monitoring. It’s a favorite among small to mid-market organizations, including retail stores and corporate offices, because it simplifies tracking everything from network devices to system performance in a single application. Its auto-discovery feature quickly maps your entire infrastructure, providing immediate visibility.
This platform excels in on-premises environments where granular control is key. For businesses managing BYOD policies or guest Wi-Fi with captive portals, PRTG's specific sensors for Cisco and Meraki hardware are invaluable. You can monitor bandwidth usage, device health, and connection quality, which is crucial for ensuring smooth authentication via solutions like iPSK or EasyPSK. Its straightforward nature makes it a solid choice for organizations needing robust, but not overly complex, network performance monitoring tools.
Key Features & Use Cases
- Sensor-Based Monitoring: Utilizes over 250 pre-configured sensor types to monitor traffic, packets, and specific hardware.
- Auto-Discovery & Maps: Automatically discovers devices and creates real-time, interactive network maps.
- Custom Alerts: Set up flexible and specific alerts via email, SMS, or push notifications to stay ahead of issues.
- Remote Probes: Deploy lightweight probes to monitor separate networks, such as different retail locations or campus buildings, from one central installation.
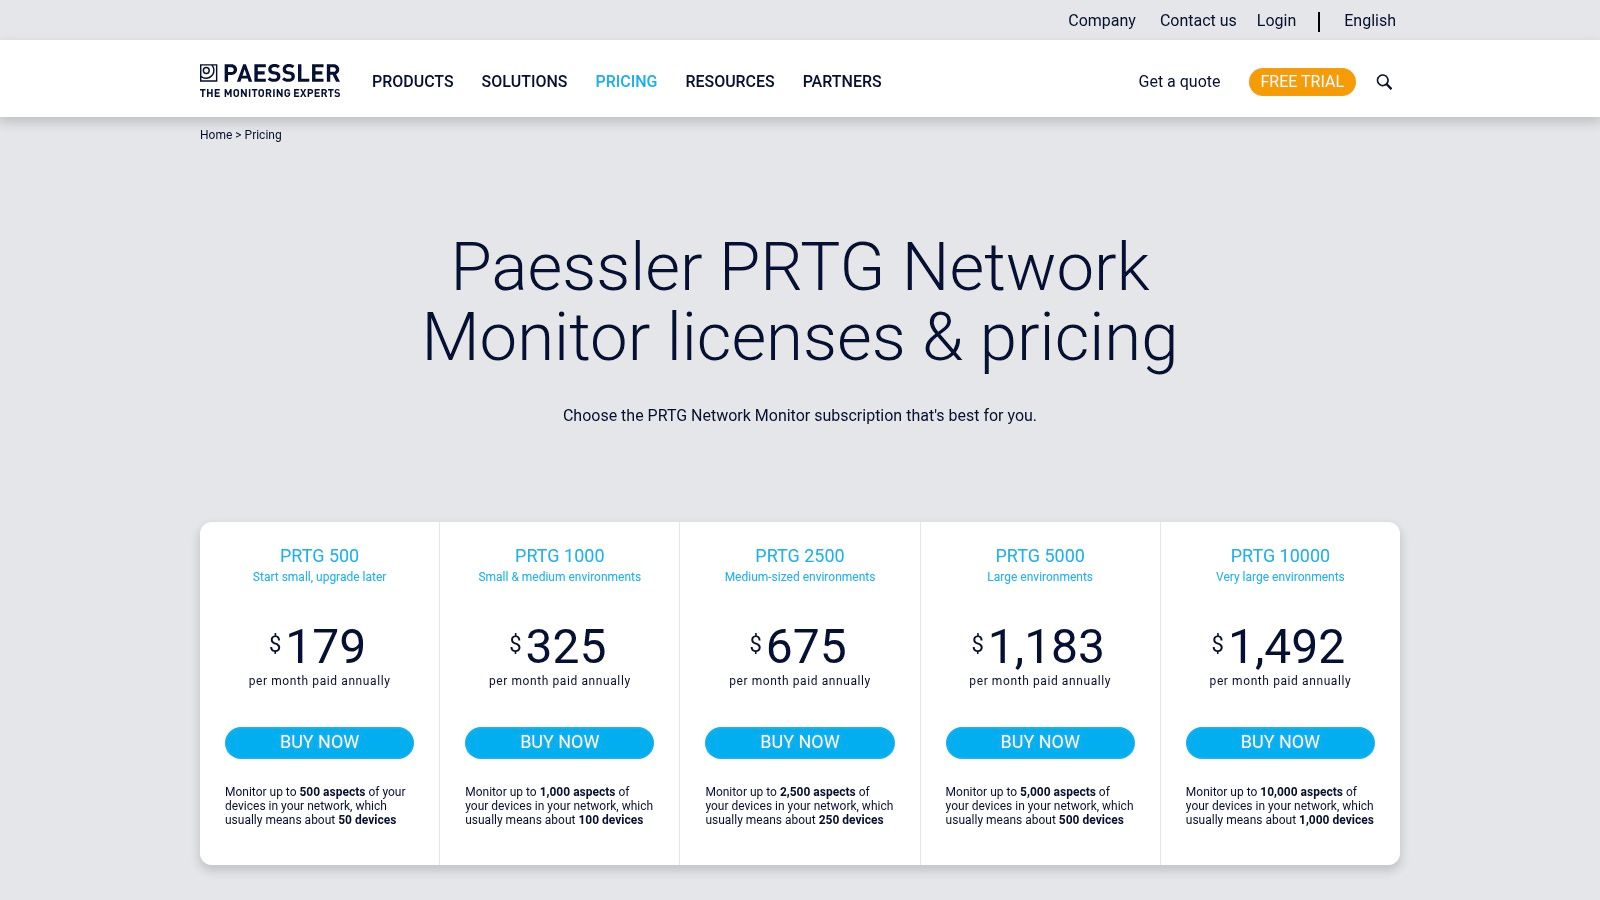
Pricing and Onboarding
PRTG offers a refreshingly transparent, perpetual license model based on the number of sensors you need. It has a generous free tier for up to 100 sensors and a 30-day unlimited trial, making it easy to test fully. While the initial setup is on-premises, the process is well-documented. Be aware that costs are directly tied to sensor count, so planning your monitoring scope is important to manage the budget.
Pro Tip: Use PRTG's custom sensors to monitor the performance of your captive portal services directly. Tracking uptime and response time helps ensure your guest or BYOD user onboarding process is seamless. This is a vital aspect of strengthening network security for small businesses.
- Website: https://www.paessler.com/pricing
4. ManageEngine OpManager
ManageEngine OpManager provides a robust, device-centric approach to network performance monitoring, making it a strong choice for organizations that prefer on-premises control. Its strength lies in real-time visibility across physical and virtual devices, which is essential for environments in education, retail, and corporate sectors managing heavy BYOD traffic. OpManager excels at monitoring critical network hardware, including Cisco and Meraki devices, ensuring consistent performance for guest Wi-Fi and captive portals.
The platform’s modular design allows you to add capabilities like flow analysis and configuration management as needed. This scalability is ideal for growing organizations that need to maintain reliable authentication solutions like iPSK or EasyPSK without over-investing upfront. Its detailed Layer 2 and Layer 3 topology maps help IT teams visualize network paths and quickly perform root cause analysis when performance issues arise, minimizing downtime for end-users.
Key Features & Use Cases
- Real-Time Device Monitoring: Get instant health and performance data for routers, switches, servers, and firewalls.
- Network Visualization: Use automated topology maps to understand device dependencies and troubleshoot connectivity.
- Modular Add-Ons: Expand functionality with optional modules for NetFlow analysis, configuration management, and more.
- Advanced Alerting: Configure multi-level, threshold-based alerts to proactively address potential issues before they impact users.
Pricing and Onboarding
ManageEngine offers transparent pricing with both perpetual and subscription licenses, catering to different budgetary models. Pricing is typically based on the number of devices monitored, with different editions (Standard, Professional, Enterprise) available. While the on-premises setup is more involved than SaaS tools, it gives you complete data control. Add-ons are priced separately, so factor them into your total cost of ownership.
Pro Tip: Leverage OpManager’s discovery rule engine during setup to automatically categorize devices by vendor (like Cisco or Meraki) or location. This helps organize your network from day one and simplifies the process of creating specific monitoring policies for different user groups or campus buildings.
5. LogicMonitor – LM Envision
LogicMonitor provides a powerful, cloud-hosted observability platform that excels in delivering comprehensive network performance monitoring. Its agentless approach and vast library of over 3,000 integrations make it an excellent choice for organizations in retail, education, and corporate sectors managing diverse hardware, including critical Cisco and Meraki devices. This streamlined monitoring is vital for maintaining the performance of guest Wi-Fi, captive portals, and complex authentication systems like iPSK.
The platform’s strength lies in its AI-driven analytics, which help IT teams cut through alert noise and focus on what matters. With dynamic thresholds and event correlation, LogicMonitor can proactively identify issues before they impact end-users, whether they are students on a campus network or employees in a BYOD environment. Its automated topology mapping provides a clear visual of network dependencies, simplifying troubleshooting significantly.
Key Features & Use Cases
- Agentless Discovery: Quickly discover and monitor network devices with polling intervals as fast as 30 seconds.
- AI-Powered Analytics: Use AIOps to reduce alert fatigue and correlate events across your infrastructure.
- Topology Mapping: Automatically generate network maps to visualize dependencies and pinpoint bottlenecks.
- Custom Dashboards: Create tailored views that track performance metrics crucial for your specific Wi-Fi and network services.
Pricing and Onboarding
LogicMonitor’s pricing is based on a per-resource model with different package tiers. While its SaaS nature allows for very rapid deployment, be aware that certain advanced features like log management and extended data retention are often priced as separate add-ons. This can increase the total cost of ownership as your monitoring needs scale, so it’s important to plan your budget accordingly.
Pro Tip: Leverage LogicMonitor’s pre-built integration modules for Cisco and Meraki to get up and running quickly. You can then customize alert thresholds based on usage patterns specific to different user groups, such as guests or staff, to ensure reliable Wi-Fi authentication.
6. Dynatrace – Platform Subscription
Dynatrace offers an all-in-one observability platform where its network performance monitoring capabilities are deeply integrated with AI-powered analytics. Its strength lies in automatically discovering and mapping entire hybrid-cloud ecosystems, providing a single source of truth for complex IT environments. This is particularly valuable for organizations in education or retail that manage a wide array of devices and services across distributed locations.
The platform's AI engine, Davis, excels at identifying the root cause of issues, cutting through the noise to pinpoint problems that could affect Wi-Fi performance, captive portal access, or authentication systems. For businesses with Cisco or Meraki hardware, Dynatrace can monitor network health in the context of application performance, which is vital for maintaining a seamless BYOD experience. This holistic view ensures that network bottlenecks are correlated with user-facing impacts, making it one of the most intelligent network performance monitoring tools available.
Key Features & Use Cases
- AI-Powered Root Cause Analysis: Automatically detects and diagnoses performance anomalies across your entire stack.
- Full-Stack Observability: Combines network data with logs, metrics, and user experience data for complete visibility.
- Cloud-Native Support: Ideal for dynamic and ephemeral workloads found in modern cloud environments.
- Extensive Integrations: Offers over 600 integrations to connect with your existing tools and services.
Pricing and Onboarding
Dynatrace provides public, usage-based pricing under a single platform subscription, which simplifies contracts. This model is flexible for scaling with cloud usage. However, the multiple metered dimensions (e.g., hosts, services, user sessions) can make cost forecasting complex, and the platform is positioned at a premium price point suited for large enterprises.
Pro Tip: Use Dynatrace’s Real User Monitoring (RUM) to trace user journeys starting from their device, through your Wi-Fi network, and to the application backend. This end-to-end visibility helps diagnose whether slow captive portal load times are a network, server, or application issue.
- Website: https://www.dynatrace.com/pricing/
7. Cisco ThousandEyes
Cisco ThousandEyes provides unparalleled visibility into internet and digital experiences, making it one of the essential network performance monitoring tools for businesses that rely on external services. It moves beyond traditional LAN monitoring to diagnose issues across the public internet, offering deep insights into how cloud services, SaaS applications, and APIs are performing from the user's perspective. This is particularly valuable for retail or corporate environments that depend on cloud-based authentication or captive portal services.
Its strength lies in its multi-layer testing capabilities, from Layer 2 up to Layer 7, combined with endpoint agents that measure real user experience. For organizations heavily invested in Cisco hardware, the native integration with Catalyst, Meraki, and Nexus devices provides a holistic view. This allows IT teams in education or BYOD-heavy offices to pinpoint whether a Wi-Fi issue is local to a Meraki access point or caused by an ISP routing problem miles away, which could affect authentication solutions like iPSK or EasyPSK.
Key Features & Use Cases
- Internet & WAN Visibility: Visualize network paths hop-by-hop to identify routing issues outside your network.
- Endpoint Experience: Deploy agents on user devices to monitor performance directly from their perspective.
- Cisco Ecosystem Integration: Gain deeper insights by combining ThousandEyes data with your existing Cisco Catalyst and Meraki infrastructure.
- Synthetic & Transaction Monitoring: Proactively test the availability and performance of critical web applications and captive portals.
Pricing and Onboarding
ThousandEyes operates on a quote-based pricing model determined by the number of units and tests you need. This requires some initial planning to size your environment correctly, and there are typically minimum user and unit thresholds. While not as straightforward as a public pricing page, the tailored approach ensures the solution fits complex enterprise needs. The platform is SaaS-based, simplifying the deployment of its cloud and enterprise agents.
Pro Tip: Use endpoint agents on a select group of devices across different user segments (e.g., students on campus, remote corporate staff, in-store retail employees) to create a baseline for digital experience. This helps you quickly identify when a performance dip is widespread versus isolated.
- Website: https://www.thousandeyes.com/
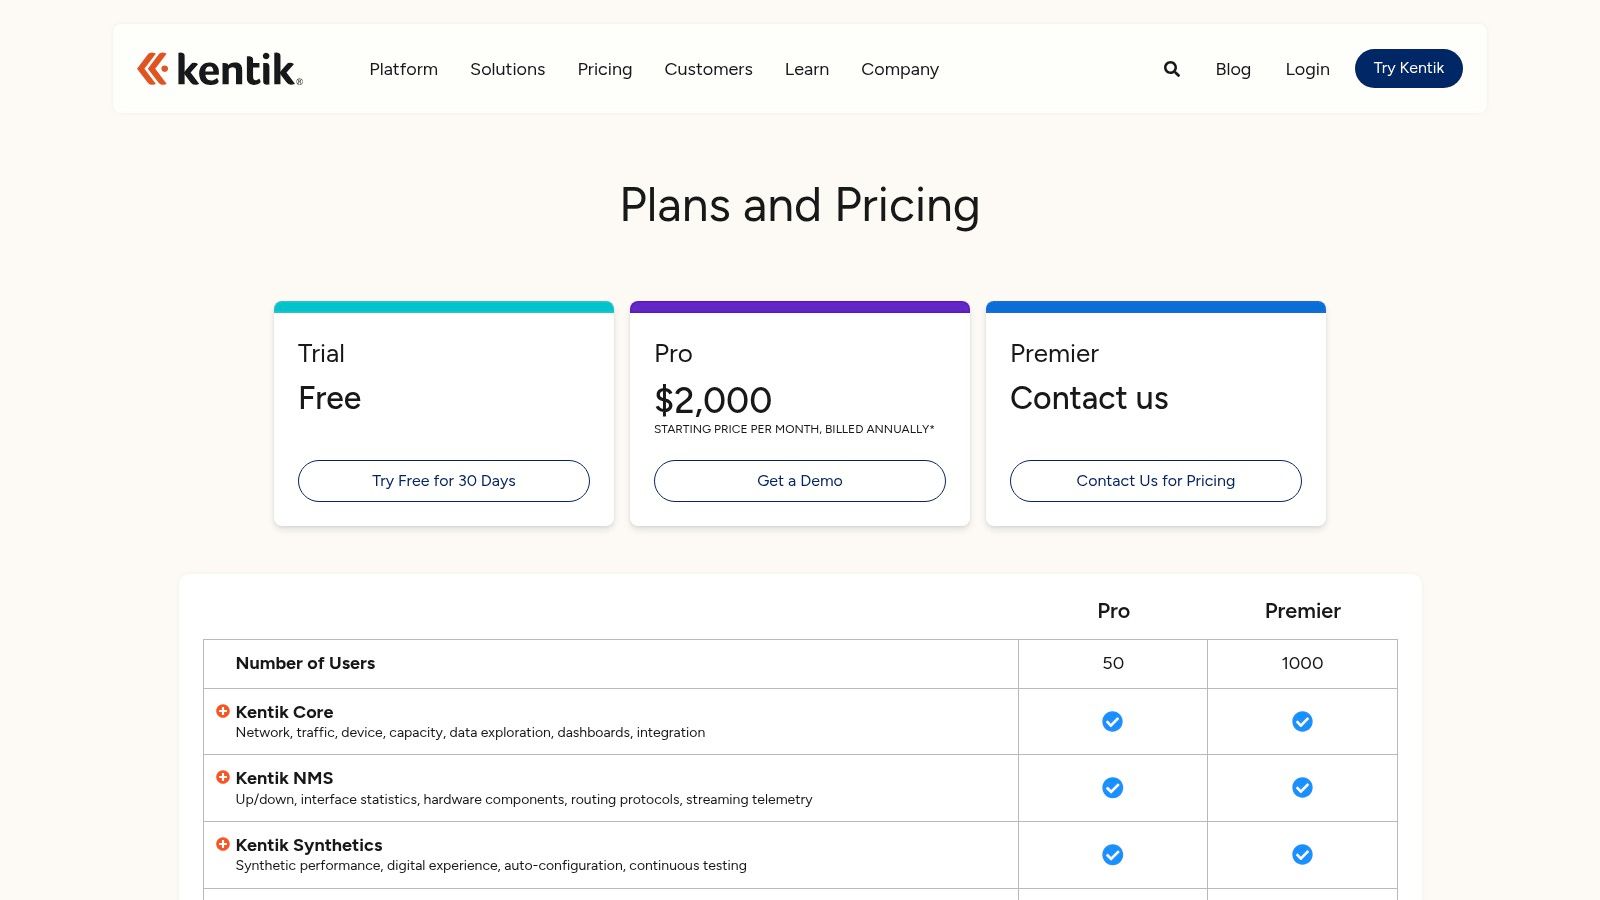
8. Kentik – Network Observability
Kentik provides a powerful SaaS-based network observability platform tailored for large-scale environments. It excels at delivering deep visibility into network traffic and performance, making it an excellent choice for enterprises, service providers, and large educational institutions managing complex network demands. Its ability to analyze massive volumes of flow data helps organizations understand exactly how their bandwidth is being used, which is essential for optimizing guest Wi-Fi and corporate network performance.
The platform’s strength lies in its advanced flow analytics, supporting NetFlow, sFlow, and IPFIX, which is invaluable for troubleshooting issues related to captive portals or specific authentication solutions like iPSK. For businesses running extensive Cisco or Meraki infrastructures, Kentik’s SNMP and streaming telemetry monitoring provides health data on key devices. This comprehensive approach makes it one of the leading network performance monitoring tools for identifying bottlenecks and security threats like DDoS attacks.
Key Features & Use Cases
- Large-Scale Flow Analytics: Ingest and analyze vast amounts of flow data to trace traffic patterns and pinpoint performance issues.
- Device Health Monitoring: Keep a close watch on routers and switches through SNMP and modern streaming telemetry.
- Cloud Performance Optimization: Gain visibility into cloud network traffic to manage costs and ensure performance.
- DDoS Detection: Proactively identify and get alerts for DDoS attacks to protect network availability.
Pricing and Onboarding
Kentik offers public pricing for its Pro tier, though the entry point is geared towards larger organizations, starting at $2,000 per month. This SaaS solution allows for relatively quick setup. Be aware that advanced features like DDoS mitigation and deeper cloud integrations are often sold as add-ons, which can increase the overall cost. The "My Kentik Portal" is a great feature for service providers needing to offer multi-tenant views to their customers.
Pro Tip: Use Kentik’s powerful filtering to create dashboards specific to your BYOD policies. Segmenting traffic by user group or device type can help you quickly diagnose if a performance problem is affecting corporate users, guests, or specific applications on your Cisco or Meraki hardware.
9. Auvik – Network Management
Auvik is a cloud-based network management tool that excels in its simplicity and effectiveness, making it a favorite among Managed Service Providers (MSPs) and internal IT teams. Its strength lies in automated network discovery and real-time topology mapping, which provides an instant, accurate picture of the entire network infrastructure. This is particularly valuable for complex environments in retail or education managing a mix of devices, including Cisco and Meraki hardware.
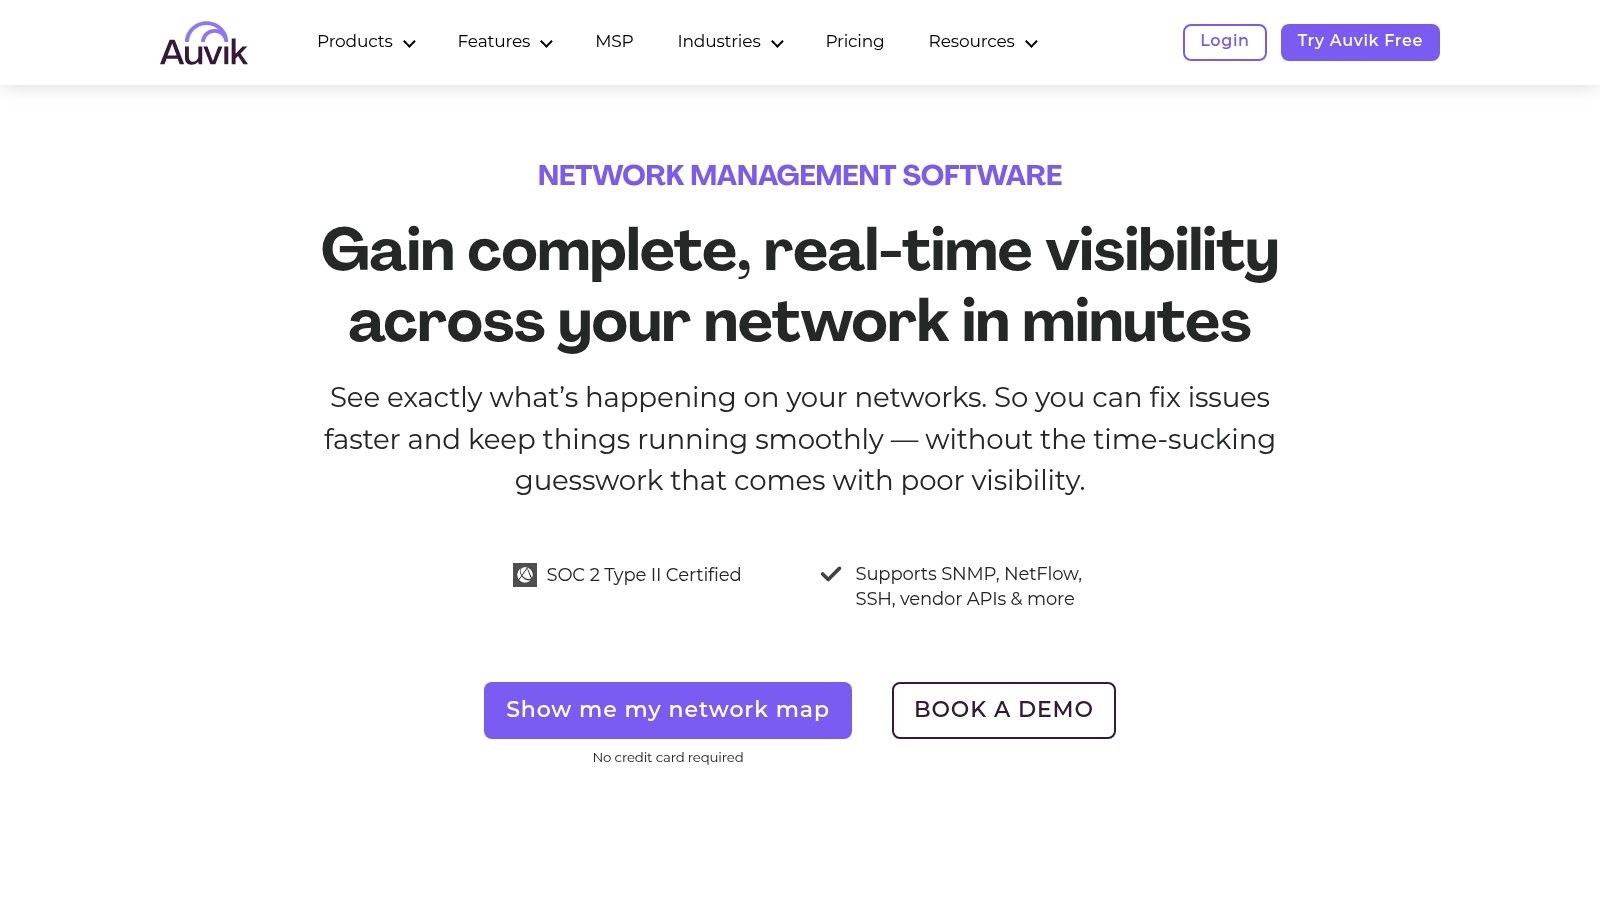
The platform is designed with multi-tenancy in mind, allowing MSPs to manage multiple client sites from a single dashboard. For organizations with distributed locations like retail chains or university campuses, Auvik's ability to automatically back up network configurations and track changes is a lifesaver. It simplifies troubleshooting and ensures that critical infrastructure supporting guest Wi-Fi, captive portals, and authentication systems remains stable and secure.
Key Features & Use Cases
- Auto-Discovery and Topology Maps: Instantly visualize your network and see how every device is connected.
- Configuration Backup: Automatically save device configurations and get alerted to any changes.
- Traffic & SNMP Insights: Use NetFlow and SNMP to monitor bandwidth usage and the health of switches and access points.
- Multi-Site Management: Ideal for MSPs or businesses with multiple locations, offering segmented and secure access.
Pricing and Onboarding
Auvik uses a transparent, per-device pricing model that is straightforward and easy to understand, though you typically need to request a quote for exact figures. The SaaS-based platform allows for rapid deployment without needing on-premise servers. While it doesn't offer the deep application-layer correlation of some observability platforms, its focused approach to network management is highly efficient.
Pro Tip: Use Auvik's topology map to identify bottlenecks and ensure your hardware can handle traffic demands. Understanding your infrastructure is the first step in deciding when to use different types of hardware, like when comparing a managed vs unmanaged switch.
- Website: https://www.auvik.com/
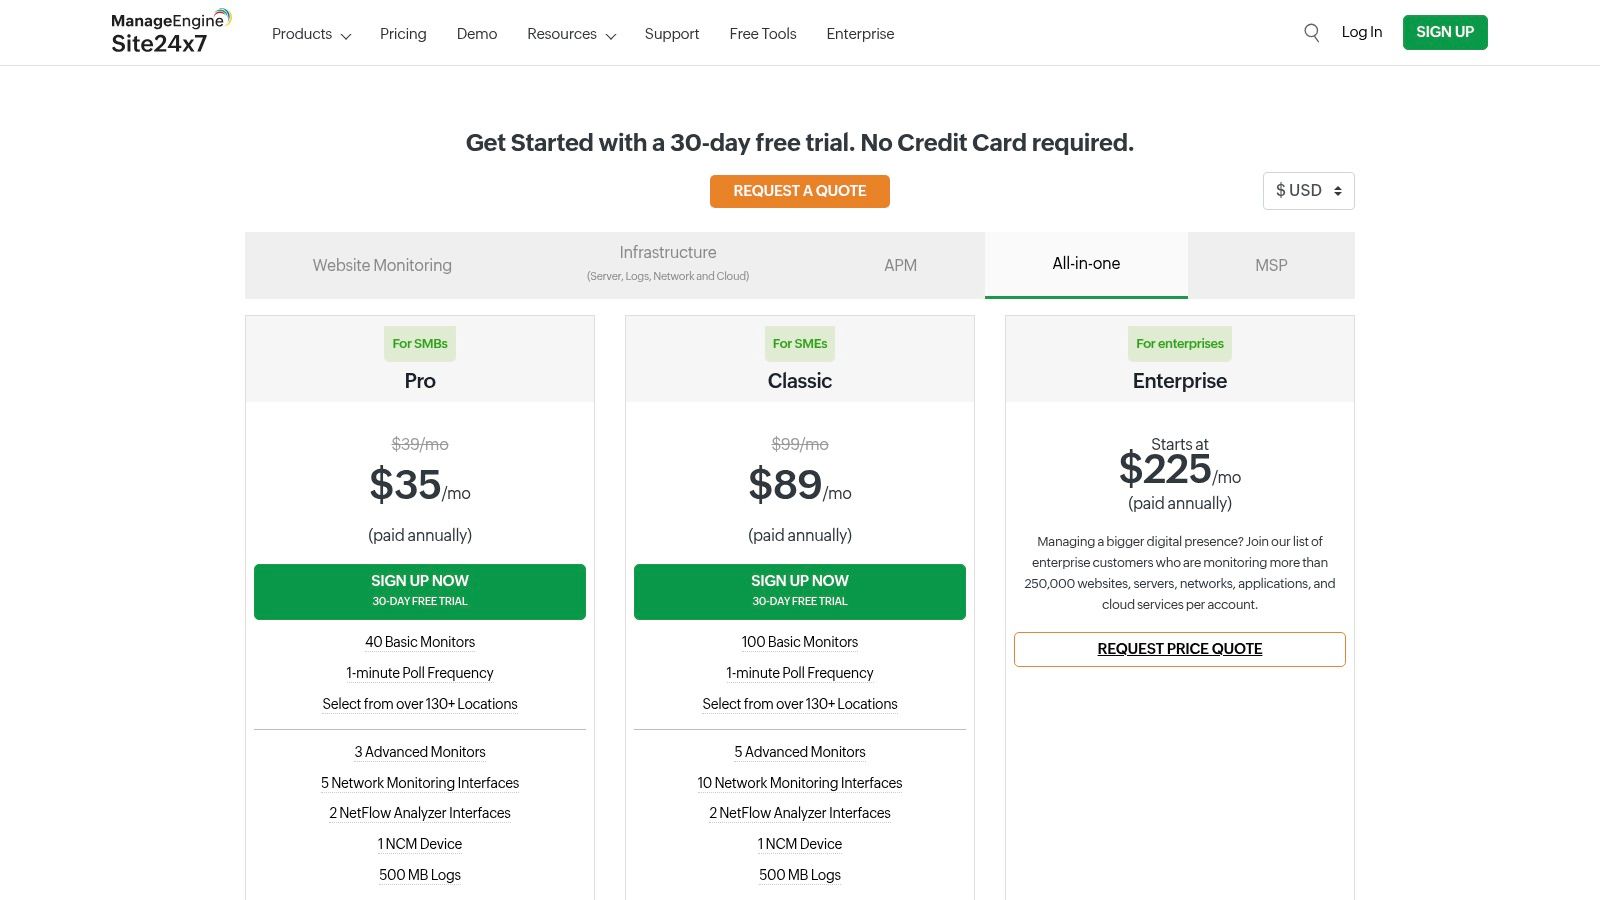
10. Site24x7 – Network Monitoring
Site24x7 offers an all-in-one monitoring solution that is particularly well-suited for small to mid-market businesses. Its strength lies in combining server, application, and network performance monitoring into a single platform with highly transparent pricing. This makes it a great entry point for organizations needing comprehensive visibility without the complexity of enterprise-grade tools.
This platform excels at providing core network insights through SNMP, supporting key hardware from vendors like Cisco and Meraki. Its NetFlow analysis and Network Configuration Manager add-ons allow IT teams to dig deeper into traffic patterns and automate backups. For retail stores or school campuses, this visibility is vital for ensuring guest Wi-Fi and authentication solutions like EasyPSK are performing correctly, helping administrators understand bandwidth usage across different user groups.
Key Features & Use Cases
- All-in-One Monitoring: Combines network device monitoring with server, web, and application performance data.
- NetFlow Analysis: Use the add-on to identify top traffic consumers and troubleshoot network slowdowns.
- Global Polling: Test network availability and latency from over 130 global locations, ideal for distributed businesses.
- Configuration Management: Automate configuration backups and manage changes to network devices like switches and routers.
Pricing and Onboarding
Site24x7 stands out with its clear, public pricing and a free-forever plan for basic monitoring. A 30-day trial is available for all paid plans. The model is built on a base plan with granular add-ons for interfaces, NetFlow, and configuration management. This allows businesses to start small and scale, but be aware that costs can grow as you add more features and devices.
Pro Tip: Leverage the 1-minute polling interval to get near real-time alerts on critical devices, such as the core switches that support your captive portal. This rapid feedback is essential when you set up a guest Wi-Fi network and need to ensure uptime.
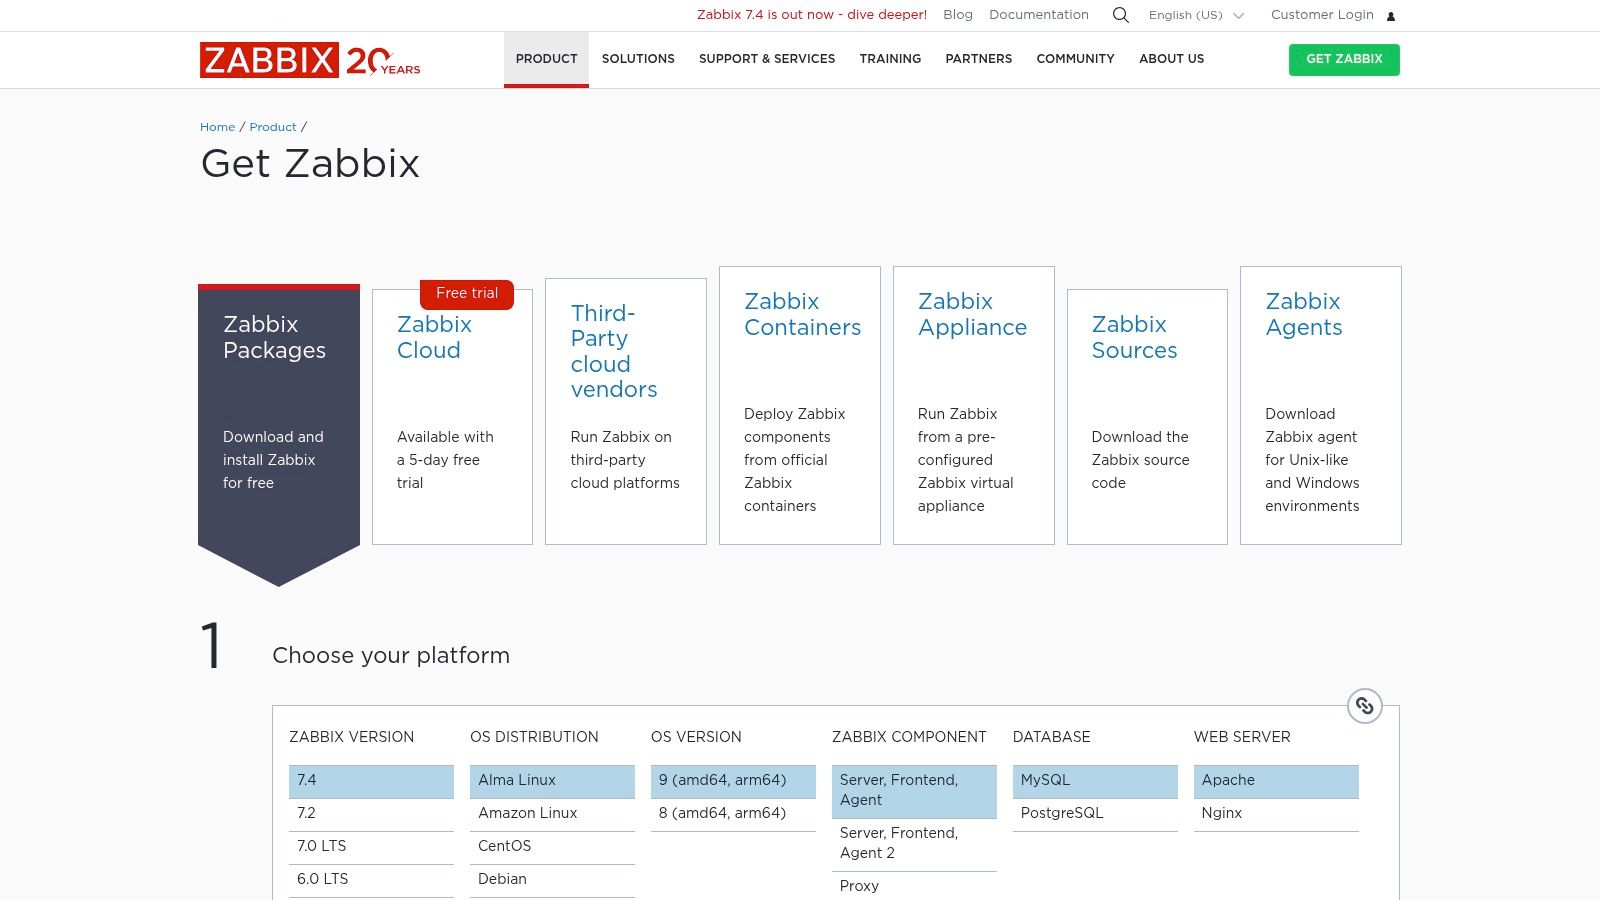
11. Zabbix
Zabbix offers a powerful and flexible open-source solution for network performance monitoring, making it a go-to choice for organizations that need enterprise-grade capabilities without the licensing fees. It provides a comprehensive framework for monitoring everything from network devices to servers and applications, making it highly adaptable for complex environments like university campuses, retail chains, or corporate offices managing extensive BYOD policies.
This platform's strength lies in its extensibility. You can monitor Cisco and Meraki hardware using SNMP, collect flow data to analyze traffic, and set up auto-discovery to automatically find and monitor new devices on your network. This is crucial for maintaining the performance of guest Wi-Fi, captive portals, and authentication systems like iPSK or EasyPSK, ensuring a seamless user experience. While it requires more hands-on setup, the trade-off is complete control and zero software cost.
Key Features & Use Cases
- Agent & Agentless Monitoring: Utilizes agents, SNMP, and telemetry for comprehensive data collection.
- Auto-Discovery: Automatically detects and adds network devices, saving significant administrative time.
- Deep Customization: Use templates and APIs to tailor monitoring to your specific hardware and software stack.
- Distributed Monitoring: Ideal for geographically dispersed sites, like multiple retail stores or campus buildings.
Pricing and Onboarding
Zabbix is completely free to download and use, with no licensing costs. This is a significant advantage for budget-conscious organizations. However, the initial setup and ongoing maintenance require in-house technical expertise. For those needing assistance, Zabbix offers optional paid support, consulting, and training services through various contract levels, providing enterprise-level assurance when needed.
Pro Tip: Leverage the large Zabbix community and the vast library of vendor-provided templates. You can find pre-built templates for Cisco, Meraki, and other common network hardware, which drastically speeds up the initial configuration process for your network performance monitoring tools.
- Website: https://www.zabbix.com/download/
12. CDW – Network Monitoring/Management Software
For IT procurement teams, CDW simplifies the process of purchasing and renewing licenses for various network performance monitoring tools. Instead of being a single software platform, CDW is an enterprise reseller that provides a centralized marketplace for acquiring solutions from major vendors. This is particularly valuable for large organizations in education, retail, and corporate sectors that need to manage procurement and contract renewals through a single, reputable supplier.
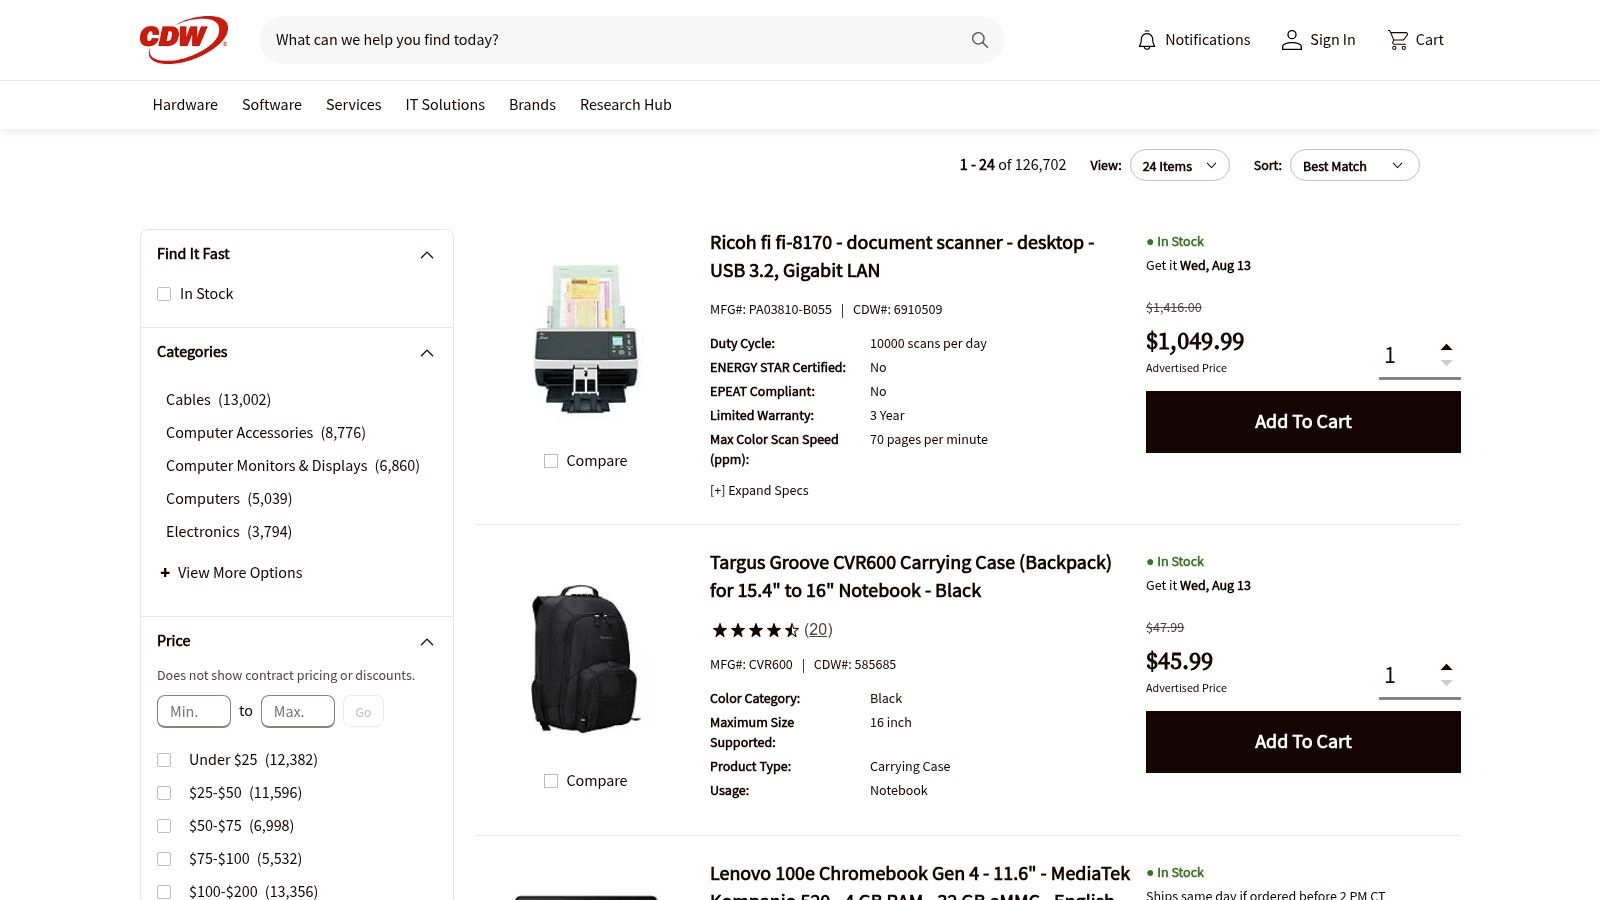
This one-stop-shop approach streamlines sourcing for tools that monitor critical hardware from Cisco and Meraki, ensuring Wi-Fi networks and captive portals operate flawlessly. For environments with extensive BYOD policies, managing software licenses efficiently is key to maintaining network integrity. CDW's value lies in its procurement infrastructure, offering quoting, volume discounts, and specialized government or education pricing. It is a crucial resource for teams who have already evaluated a tool and are ready to purchase.
Key Features & Use Cases
- Centralized Procurement: Source licenses and renewals for multiple network monitoring tools from a single vendor.
- Contract Management: Simplifies tracking renewal dates and licensing for large-scale deployments.
- Specialized Pricing: Access government (GSA) and education-specific pricing tiers not always available publicly.
- Real-time Availability: View in-stock licenses and SKUs for immediate purchase and deployment planning.
Pricing and Onboarding
Pricing on CDW is SKU-based and often requires generating a quote, especially for volume purchases or specific contract terms. While public pricing is sometimes listed, engaging with a sales representative is typical for securing the best deal. Onboarding is not applicable as CDW is a reseller, not a software provider. The value is in the procurement process, not the technical implementation, which remains the responsibility of the software vendor.
Pro Tip: Use CDW to standardize your procurement workflow. Before purchasing, ensure the specific software supports monitoring for your captive portal authentication solutions, like iPSK or EasyPSK, to maintain a secure and seamless user experience.
Top 12 Network Monitoring Tools Comparison
| Solution | Core Features / Highlights | User Experience / Quality ★ | Value Proposition 💰 | Target Audience 👥 | Unique Selling Points / Differentiators ✨ |
|---|---|---|---|---|---|
| Datadog – Network Monitoring | Cloud network & device monitoring, NetFlow analytics | ★★★★☆ Clear UI, strong integrations | Transparent per host/device pricing 💰 | Hybrid & multi-cloud enterprises 👥 | Fast SaaS onboarding, extensive tagging & alerting |
| SolarWinds – NPM | Multi-vendor device monitoring, NetPath & PerfStack | ★★★★☆ Enterprise-grade deep toolset | Quote-based, complex pricing | On-prem & hybrid enterprise users 👥 | Advanced troubleshooting workflows, topology visualization |
| Paessler PRTG Network Monitor | 250+ sensors, auto-discovery, multi-OS probes | ★★★★☆ Transparent, customizable dashboards | Clear tiered pricing + free tier 💰 | SMB to mid-market organizations 👥 | Sensor-based monitoring, free 100-sensor trial |
| ManageEngine OpManager | Real-time device & WAN monitoring, topology maps | ★★★★ Clear licensing, scalable editions | Mixed licensing; add-ons increase cost | Small to multi-site enterprises 👥 | Perpetual/subscription models, root cause analysis |
| LogicMonitor – LM Envision | Agentless discovery, AI event correlation, flow visibility | ★★★★☆ AI-supported noise reduction | Per-resource + add-ons pricing | Large enterprises & IT operators 👥 | AI-driven analytics, 3000+ integrations |
| Dynatrace – Platform Subscription | Full-stack infra monitoring, synthetic and RUM | ★★★★★ Strong AI root cause detection | Usage-based, transparent pricing | Dynamic cloud environments 👥 | AI-powered insights, cloud workload scalability |
| Cisco ThousandEyes | Multi-layer internet testing, Cisco device integration | ★★★★ Deep Cisco ecosystem integration | Quote-based, custom sizing | Enterprises needing internet-level insights 👥 | Internet routing visibility, endpoint & cloud deployments |
| Kentik – Network Observability | Flow analytics, device health, DDoS detection | ★★★★ Large scale flow analytics | Starts at $2,000/month, add-ons cost more | Mid-market & enterprise customers 👥 | Cloud cost optimization, My Kentik multi-tenant portal |
| Auvik – Network Management | Auto-discovery, config backup, topology maps | ★★★★ MSP & IT team focused | Device-based pricing, quote-based | MSPs & IT operations 👥 | Multi-tenant billing, role-based access control |
| Site24x7 – Network Monitoring | Network monitoring, NetFlow, switch-port config add-ons | ★★★★ Transparent US pricing, easy plans | Free basic & trials available 💰 | SMB to mid-market users 👥 | 130+ global locations, 1-min polling |
| Zabbix | Free open-source with SNMP, flow, auto-discovery | ★★★★ DIY setup, extensible platform | No licensing fees, paid support optional 💰 | US teams wanting no-license software 👥 | Highly customizable, APIs & visualization tools |
| CDW – Network Monitoring/Management | Vendor license reseller with catalog & financing support | ★★★★ Convenient multi-vendor procurement | Vendor pricing & quote based | Enterprises & government buyers 👥 | One-stop sourcing, financing options |
Beyond Monitoring: Elevating Your Network's User Experience
Navigating the landscape of network performance monitoring tools can feel overwhelming, but making an informed choice is a critical first step toward operational excellence. Throughout this guide, we've explored a dozen powerful solutions, from the extensive observability of Datadog and Dynatrace to the targeted network visibility offered by tools like SolarWinds NPM, Paessler PRTG, and Cisco ThousandEyes. Each platform provides a unique lens through which to view your network's health, offering deep insights into traffic flow, device status, and potential bottlenecks.
The key takeaway is that there is no single "best" tool; the right choice depends entirely on your organization's specific context. A sprawling university campus with a massive BYOD policy has different needs than a retail chain focused on uptime for its point-of-sale systems, or a corporate office managing secure guest access. Your selection process must be guided by your environment, existing infrastructure like Cisco Meraki, technical expertise, and, of course, your budget.
From Data Points to Strategic Action
Having explored the pros, cons, and ideal use cases for each tool, it's time to translate that knowledge into a concrete plan. The ultimate goal of implementing any of these platforms is to move from a reactive "break-fix" model to a proactive, strategic approach to network management.
Here are the actionable next steps to guide your decision:
- Define Your Core Needs: Are you primarily focused on troubleshooting latency in a corporate BYOD setting, ensuring uptime for critical retail applications, or managing bandwidth across a large educational campus? Create a checklist of your top 3-5 "must-have" monitoring capabilities.
- Assess Your Infrastructure: Consider your current hardware. If you're heavily invested in the Cisco Meraki ecosystem, look for tools with strong, out-of-the-box integrations that can pull data directly from the Meraki dashboard.
- Evaluate Scalability and Usability: Think about who will be using the tool. Does your team need a simple, intuitive interface like Auvik's, or do they have the expertise to leverage the deep customization of a platform like Zabbix? Plan for future growth.
- Pilot and Test: Before committing, take advantage of free trials. Set up a pilot program to monitor a specific segment of your network. This is the only way to truly understand how a tool performs in your unique environment.
The Missing Piece: The User's First Impression
While these network performance monitoring tools are essential for keeping your network's engine running smoothly, they only tell part of the story. They monitor what happens after a user connects. But for your guests, students, or customers, the experience starts much earlier, at the point of authentication.
This is where the user journey truly begins. A generic, unsecure, or cumbersome login process can sour a user's perception before they ever experience the high-performance network you’ve so carefully built. For sectors like education, retail, and corporate environments that rely on BYOD, the captive portal is your digital front door. A seamless and secure authentication solution is the crucial link between your high-performance network and a positive user experience. This is where solutions that specialize in IPSK or EasyPSK can provide granular, secure access for every user, without the headache of shared passwords.
Ready to bridge the gap between world-class network performance and a flawless user login experience? Splash Access integrates directly with your Cisco Meraki network to provide a secure, branded, and intuitive captive portal and authentication solution. Explore how Splash Access can elevate your guest Wi-Fi experience today.


